CrossX Pro V.5 — Inputs Guide
CrossX Pro V.5 is a versatile trading indicator designed to help traders identify market trends, key support and resistance levels, divergence signals, and more. Below is a comprehensive explanation of each input section to help you customize the indicator to suit your trading style.
1. Buy and Sell Signal Settings

This section allows you to configure the Buy and Sell signals according to your preferences:
- Fix Buy and Sell Signals to Timeframe: Ensures that signals are aligned with the selected timeframe for consistency.
- Signal Smoothness: Controls how smooth the signals are by filtering out market noise. (Low, Medium, High)
- Sensitivity [1-50]: Adjusts how sensitive the signals are—higher values generate more frequent signals.
- Noise [1 to 1000]: Fine-tunes the noise filter to minimize false signals.
- Display Options:
- Enable/disable Buy and Sell Labels.
- Customize the color of Buy, Sell, Candle Paint, and the Gray Cloud.
- Show or hide Top and Bottom Reversal signals.
✅ Ideal for traders seeking clear and timely buy/sell signals that align with their strategy.
2. Divergence Settings

This section enables you to detect and display divergence signals:
- Divergence Frequency: Controls how frequently divergence signals are printed—sets the minimum number of bars needed to confirm a divergence. Lower values = more frequent signals; higher values = more selective signals.
- Confirmation Delay: Option to delay the signal until divergence is fully confirmed (non-repainting).
- Plot Options: Choose to display Regular/Hidden Bullish and Bearish Divergence.
- Line and Label Settings: Customize the colors for bullish/bearish lines and text.
✅ Helps you spot potential trend reversals through divergence with greater accuracy and customization
3. Swing Point Settings
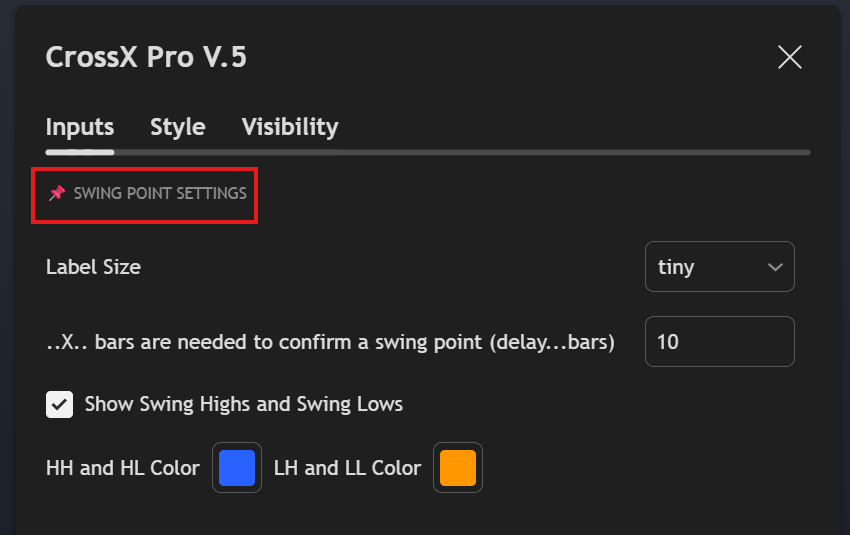
This section focuses on identifying key swing points to map out market structure:
- Label Size: Select the size of the Swing Point labels.
- Bars for Confirmation: Defines how many bars are required to confirm a swing high or swing low.
- Show Swing Highs and Lows: Toggle on/off the display of Higher Highs (HH), Higher Lows (HL), Lower Highs (LH), and Lower Lows (LL).
- Custom Colors: Customize the colors for both bullish and bearish swing labels.
✅ Useful for identifying market structure and trend changes at a glance.
4. Support and Resistance Settings

This section helps you automatically plot support and resistance levels:
- Support and Resistance Frequency Level: Controls how often support and resistance zones are drawn (Low, Medium, High).
- Type of Support and Resistance: Choose between Box or Line visualization.
- Extend Right: Option to extend support and resistance levels into the future.
- Custom Colors: Customize colors for both Support and Resistance zones.
✅ Perfect for identifying key price zones where reactions are likely to occur.
5. Market Structure Settings

This section visualizes the market structure by highlighting swing highs and lows:
- Show Market Structure: Enable or disable this feature.
- Swing Length: Sets the sensitivity of the swing detection.
- Label Size: Choose the label size for market structure points.
- Custom Colors: Define separate colors for bullish and bearish structures.
- Line Style: Select the style of lines used to connect structure points.
✅ Designed for price action traders who rely on market structure for trade decisions.
6. Overbought and Oversold Settings
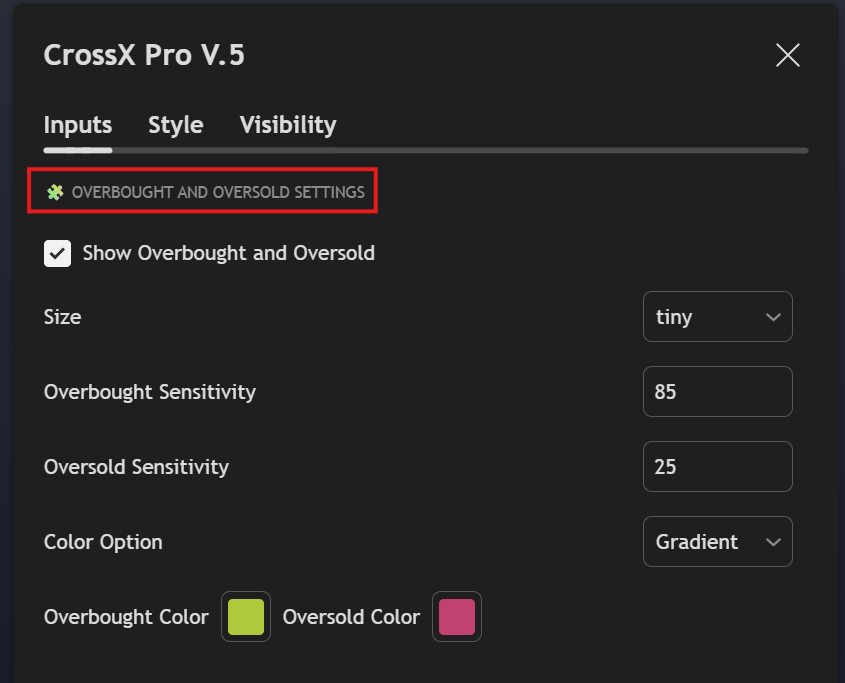
This section helps you identify potential overbought and oversold conditions:
- Show Overbought and Oversold: Enable/disable the display of these levels.
- Label Size: Adjust the label size for clarity.
- Overbought Sensitivity: Sets how sensitive the indicator is to overbought conditions.
- Oversold Sensitivity: Sets how sensitive the indicator is to oversold conditions.
- Color Option: Choose between solid or gradient colors.
- Custom Colors: Set specific colors for overbought and oversold levels.
✅ Useful for mean reversion strategies and identifying potential reversal points.
7. Gap Settings

This section allows you to detect and visualize price gaps on the chart:
- Bars to Check For: Defines how many historical bars the indicator scans for gaps.
- Label Size: Adjusts the size of the gap labels.
- Display Options:
- Show Unfilled Gaps
- Show Filled Gaps
- Extend Unfilled Gaps into the future
- Custom Colors: Set individual colors for gap types and labels.
✅ Ideal for traders who focus on gap trading or expect price to fill previous gaps.
8. Table

This section enables a data summary table on the chart for quick visual reference:
- Enable Table: Toggle the table display on or off.
- Table Position: Select the position of the table (Top, Bottom, Left, Right).
- Table Size: Choose between Small, Medium, or Large sizes.
- Custom Colors: Set colors for bullish and bearish data inside the table.
✅ Perfect for summarizing multiple market signals in one compact view.
