START USING IT
CrossX Pro V.5 is an indicator designed to help you clearly identify Buy and Sell signals. It also features a Market Dashboard to help you make decisions more easily.
The main features of CrossX Pro V5 are:
- Buy/Sell signals with candlestick coloring
- Top/Bottom Reversal signals
- Divergence signals
- Swing Points
- Gray Cloud
- Automatic Support and Resistance
- Market Structure
- Overbought and Oversold
- Gap
- Dashboard
1. Buy and Sell signals with candlestick coloring

Buy and Sell Signals Explanation
A Buy Signal—indicated by a Buy Tag and a Green Candle—appears when the market is entering a new uptrend. This signal represents an optimal entry or buying opportunity.
A Sell Signal—indicated by a Sell Tag and a Red Candle—appears when the market is in a downtrend, experiencing a reversal, or moving sideways. This signal represents an exit or selling opportunity.
Both Buy and Sell signals are also displayed on the Dashboard, specifically in the Current Timeframe Signal section for quick reference.
- Green Candles signify that an uptrend has either just started or is currently in progress. When candles transition from red to green, it indicates the beginning of an uptrend—allowing you to ride the trend from its early stages to completion, while ignoring minor fluctuations.
- Red Candles signify that a downtrend has either just started or is currently in progress. When candles transition from green to red, it signals the start of a downtrend or a sideways market—helping you stay in short positions and avoid premature buying.
2. Top/Bottom Reversal signals
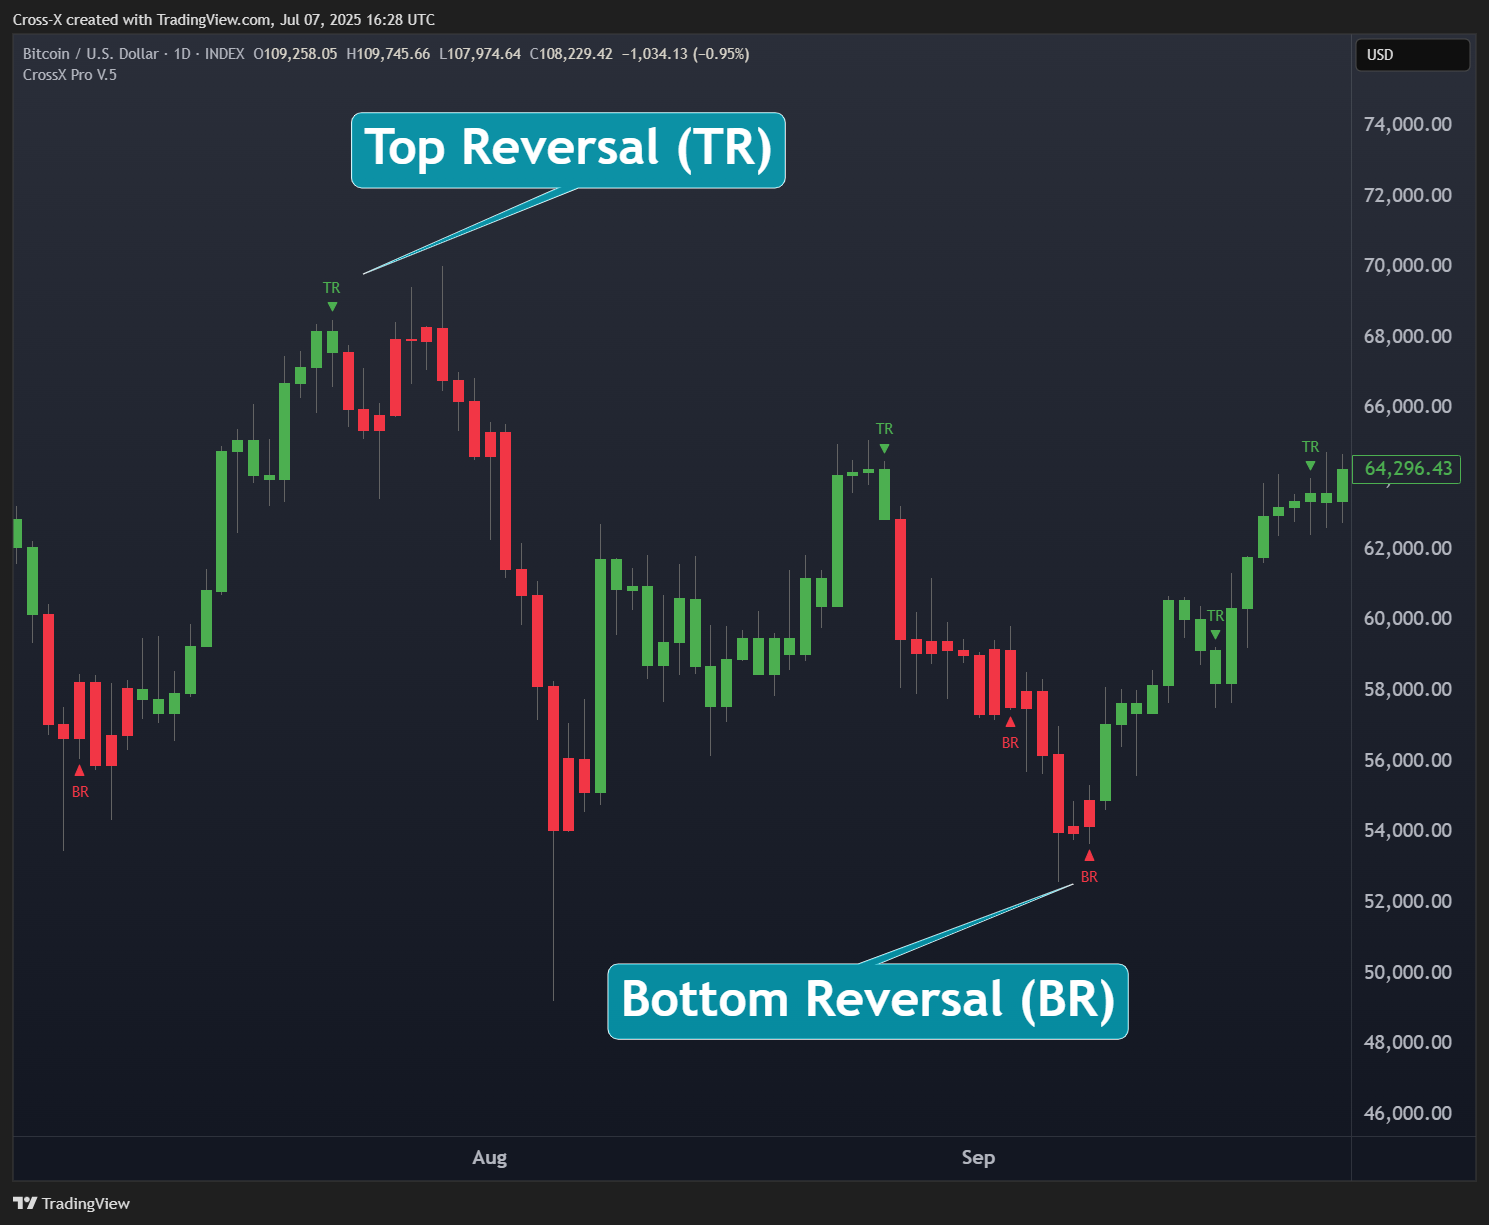
Top Reversal (TR) & Bottom Reversal (BR) Signals
Top Reversal (TR)
The TR signal indicates a potential market top following an extended bullish move that is nearing exhaustion. When a TR signal appears, it suggests a possible reversal from an uptrend to a downtrend. Traders holding buy or long positions should consider locking in profits or reducing exposure at this point.
Bottom Reversal (BR)
The BR signal indicates a potential market bottom after a prolonged bearish move that is showing signs of exhaustion. When a BR signal appears, it suggests a possible reversal from a downtrend to an uptrend. Traders holding sell or short positions should consider taking profits or scaling back positions accordingly.
3. Divergence signals

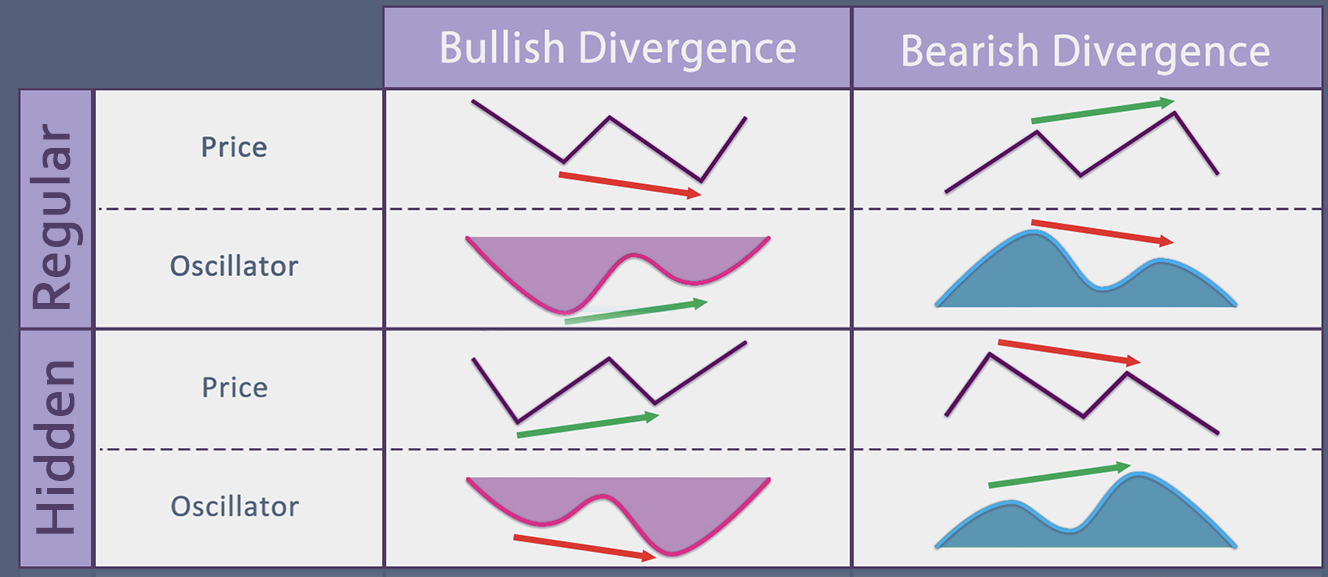
Divergence is a concept in technical analysis that occurs when an asset’s price moves in the opposite direction of oscillators. Traders use divergences to determine whether a market trend is weakening, which may lead to a consolidation phase or a trend reversal.
Regular Bullish Divergence (R Bull Div) and Hidden Bullish Divergence (H Bull Div): This situation demonstrates that bears are losing power, and bulls are ready to regain control of the market. Often, a bullish divergence marks the end of a downtrend. It may lead to a consolidation period or a trend reversal.
Regular Bearish Divergence (R Bear Div) and Hidden Bearish Divergence (H Bear Div): This situation demonstrates that bulls are losing power, and bears are ready to regain control of the market. Often, a bearish divergence marks the end of an uptrend. It may lead to a consolidation period or a trend reversal.
Divergence signals also appear on the Dashboard. They are displayed in the “Momentum” section.
4. Swing points
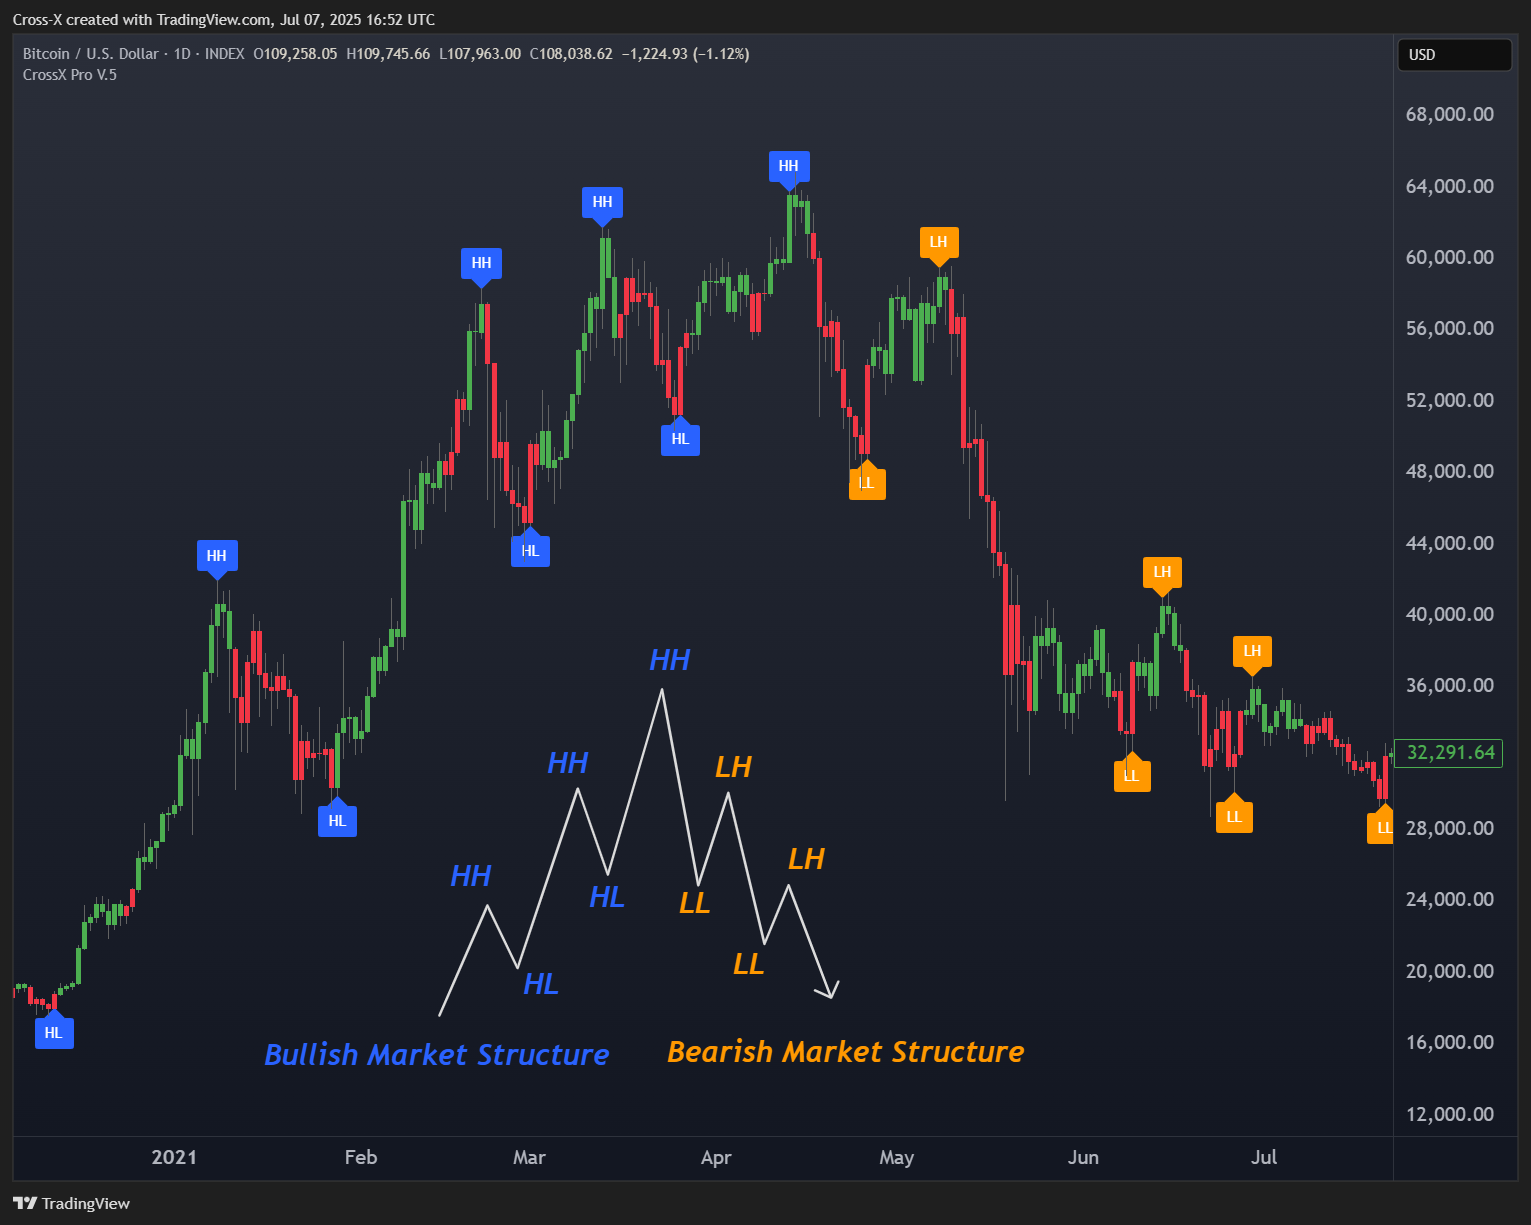
Most traders are familiar with Dow Theory and the concepts of higher highs and lower lows. Highs and lows serve as key reference points for traders.
- When both higher highs (HH) and higher lows (HL) occur, it indicates an upward trend.
- When both lower highs (LH) and lower lows (LL) occur, it indicates a downward trend.
Many traders watch these points closely. If the market price breaks above the previous swing high, the market is considered bullish. Conversely, if the price falls below the previous swing low, the market is bearish. This principle applies across all time frames.
In a sideways market, there isn’t always a clear pattern of higher or lower highs and lows. These periods are called sideways phases and come in two types:
- Range contraction: Lower highs (LH) and higher lows (HL). This narrows the trading range and signals decreasing volatility.
- Range extension: Higher highs (HH) and lower lows (LL). This widens the trading range and signals increasing volatility.
5. Gray Cloud

The cloud helps you identify whether the market is bullish or bearish. When the price is above the gray cloud, it indicates a bull market. When the price is below the gray cloud, it indicates a bear market.
The cloud also provides traders with support and resistance levels. A thick cloud represents strong support or resistance, while a thin cloud indicates weak support or resistance.
Additionally, the cloud acts like a mean reversion indicator, based on the idea that an asset’s price tends to move back toward the average price (the cloud) over time. When the current market price is below the cloud, it is expected to rise toward the cloud. Conversely, when the price is above the cloud, it is expected to fall back toward the cloud.
The gray cloud signals also appear on the Dashboard. They are displayed in the “Macro Trend” section.
6. Automatic Support and Resistance
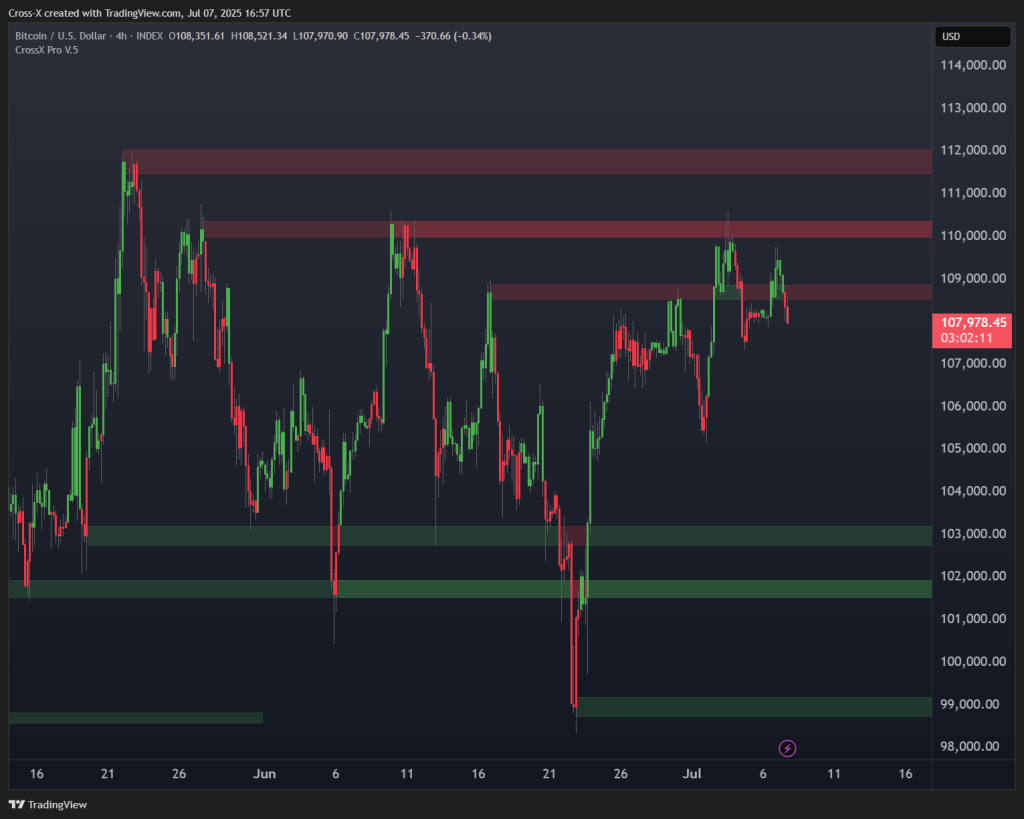
This is a function that helps analyze and automatically display Support and Resistance levels on the chart. It allows traders to easily identify key price levels where the market is likely to bounce or break through.
Key Features of Automatic Support & Resistance:
- No Manual Drawing Needed
The system automatically detects and plots key levels on the chart without requiring you to draw them yourself. - Automatic Updates
Support and resistance levels adjust dynamically based on price movements and market behavior. - Works on All Timeframes
Compatible with any timeframe, from 1-minute charts to monthly charts. - Helps Plan Entries and Exits
Clearly shows where to wait for a breakout or a rejection, making trade planning more precise
7. Market Structure
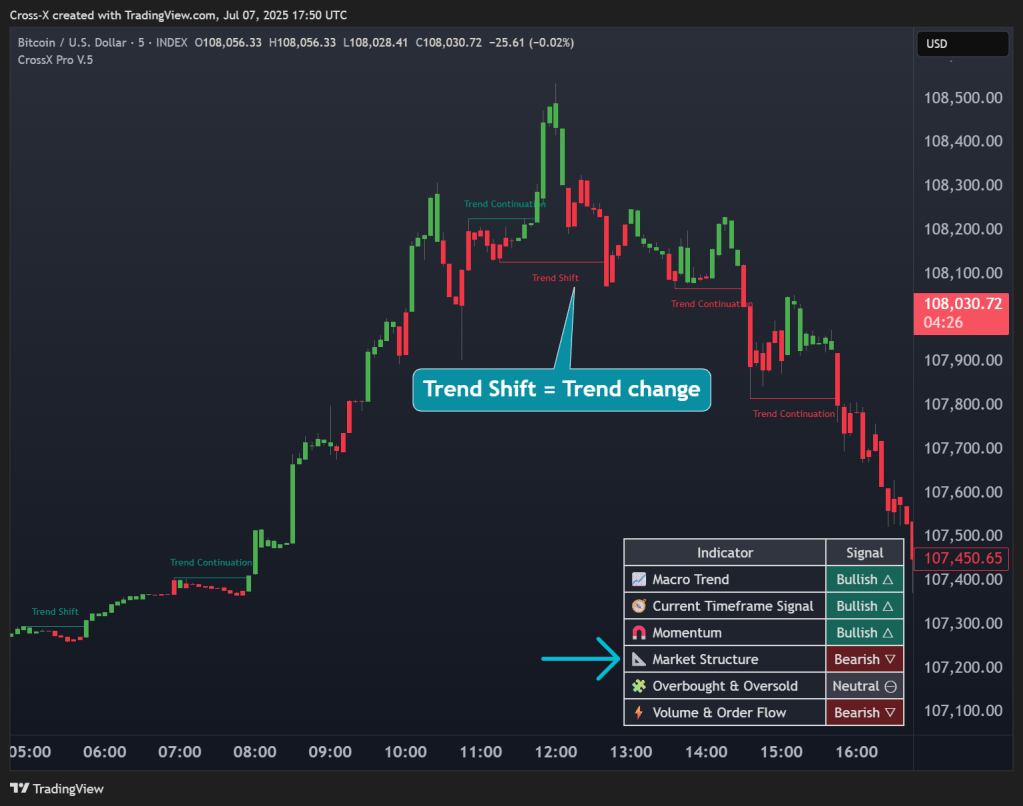
Trend Shift refers to the price breaking through a key high or low of the previous market structure, indicating a potential trend reversal or trend continuation.
Key Principles of Break of Structure:
- If the price breaks above the previous high (Swing High) → this signals an uptrend → called an Upward Trend Shift.
- If the price breaks below the previous low (Swing Low) → this signals a downtrend → called a Downward Trend Shift.
Important Note: A Trend Shift does not always mean that the trend will reverse. Sometimes, it could simply be a liquidity grab or a fake breakout.
Market Structure signals also appear on the Dashboard. They are displayed in the “Market Structure” section..
8. Overbought and Oversold
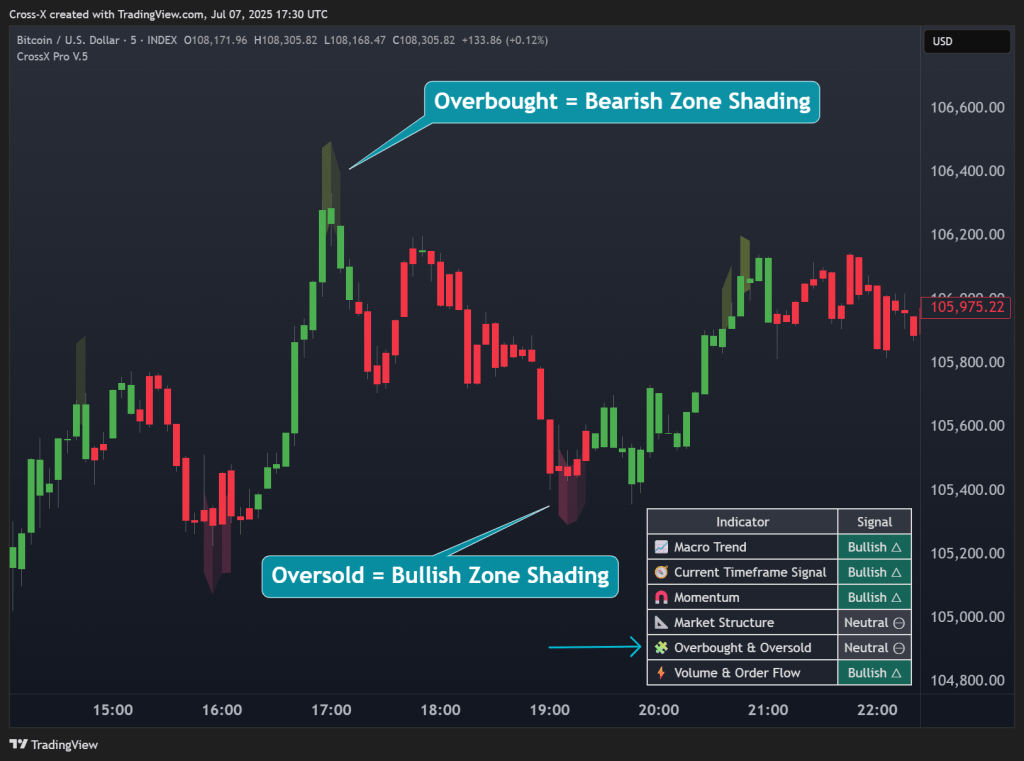
Overbought and Oversold are concepts used to identify periods when the price may be at risk of a reversal or a correction due to excessive movement in one direction within a short period of time.
Principles of Overbought & Oversold:
Overbought (OB):
- The price or indicator value is at a very high level.
- The market is likely to pull back or enter a correction phase.
Oversold (OS):
- The price or indicator value is at a very low level.
- The market is likely to bounce or recover.
Important Caution:
Do not trade against the trend immediately just because the market enters an overbought or oversold condition. These signals should be used in combination with other confirmations to support decision-making.
Overbought and Oversold signals also appear on the Dashboard. They are displayed in the “Overbought and Oversold” section.
9. Gap

Gap refers to a price area where there is a discontinuity between the closing price of one candlestick and the opening price of the next candlestick. This gap reflects an unusually strong buying or selling pressure during that period.
Types of Gaps:
- Gap Up:
- The opening price of the new candlestick is higher than the previous candlestick’s closing price.
- Often indicates strong buying pressure or positive news.
- Used to look for buying opportunities.
- Gap Down:
- The opening price of the new candlestick is lower than the previous candlestick’s closing price.
- Often indicates strong selling pressure or negative news.
- Used to look for selling opportunities.
- Gap Filled:
- Occurs when the price moves back to fill the gap (i.e., the price touches or surpasses the level where the gap occurred).
- Commonly used as a profit-taking target or to confirm a potential reversal.
- Based on the belief that the price tends to return to fill the gap → useful for reversal trades or target setting.
10.Dashboard

This dashboard is part of the CrossX Pro V.5 indicator, designed to help traders quickly assess the overall market outlook from multiple dimensions.
Explanation of Each Indicator:
- Macro Trend
- Represents the long-term market trend (derived from the Gray Cloud).
- It defines the primary direction of the market over a larger timeframe.
- Current Timeframe Signal
- Shows buy/sell signals based on the current timeframe.
- Momentum
- Measures the strength and energy of price movements (based on Divergence).
- Indicates whether momentum is supporting the trend or fading.
- Market Structure
- Analyzes price structure to determine if the market is in an uptrend, downtrend, trend shift, or trend continuation.
- Overbought & Oversold
- Identifies if the market is in an overbought (excessive buying) or oversold (excessive selling) zone.
- Volume & Order Flow
- Evaluates trading volume and order flow to detect buying/selling pressure.
How to Use:
- The Macro Trend is the core determinant of the market’s overall direction.
The other indicators help assess the short- to mid-term market conditions. - Use the combined signal view to assess trade opportunities in the short to medium term.
- If most signals are Bullish, it may suggest an uptrend or buying pressure.
- If most signals are Bearish, it may indicate a downtrend or selling pressure.
